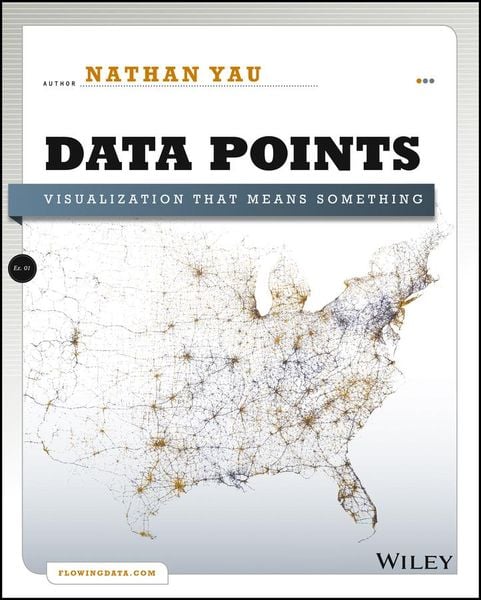
Data Points Visualization That Means Something
-
- Taschenbuch ausgewählt
- eBook
-
Sprache:Englisch
39,99 €
inkl. gesetzl. MwSt.,
Beschreibung
Produktdetails
Einband
Taschenbuch
Erscheinungsdatum
12.04.2013
Verlag
John Wiley & SonsSeitenzahl
320
Maße (L/B/H)
23,1/18,7/2 cm
Gewicht
730 g
Auflage
1. Auflage
Sprache
Englisch
ISBN
978-1-118-46219-5
Whether it's statistical charts, geographic maps, or the snappy graphical statistics you see on your favorite news sites, the art of data graphics or visualization is fast becoming a movement of its own. In Data Points: Visualization That Means Something, author Nathan Yau presents an intriguing complement to his bestseller Visualize This, this time focusing on the graphics side of data analysis. Using examples from art, design, business, statistics, cartography, and online media, he explores both standard-and not so standard-concepts and ideas about illustrating data.
* Focuses on visualization, data graphics that help viewers see trends and patterns they might not otherwise see in a table
* Includes examples from the author's own illustrations, as well as from professionals in statistics, art, design, business, computer science, cartography, and more
* Examines standard rules across all visualization applications, then explores when and where you can break those rules
Create visualizations that register at all levels, with Data Points: Visualization That Means Something.
Ein neues Kapitel für Ihre Bücher
Ein neues Kapitel für Ihre Bücher
Schenken Sie Ihren alten Schätzen ein zweites Leben und erhalten dafür eine Thalia Geschenkkarte.
Noch keine Bewertungen vorhanden
Verfassen Sie die erste Bewertung zu diesem Artikel
Helfen Sie anderen Kundinnen und Kunden durch Ihre Meinung.
Kurze Frage zu unserer Seite
Vielen Dank für Ihr Feedback
Wir nutzen Ihr Feedback, um unsere Produktseiten zu verbessern. Bitte haben Sie Verständnis, dass wir Ihnen keine Rückmeldung geben können. Falls Sie Kontakt mit uns aufnehmen möchten, können Sie sich aber gerne an unseren Kund*innenservice wenden.
zum Kundenservice