
















































KI-Beratung Beta

Gutscheinbedingungen

Gültig bis 11.11.2026 | Gültig für Spielzeug, Filme, Musik, Software, Games, Geschenke & Trends, Schreibwaren, Hörbücher und Hörbuch-Downloads (außer Abo & Shelfies), gebrauchte Bücher, nicht preisgebundene Bücher und Kalender | Einlösbar unter thalia.de und in der Thalia App | Click & Collect nur mit Online-Zahlung (Paypal/Kreditkarte) vorab | Einzelne Artikel können ausgeschlossen sein | Nicht kombinierbar mit anderen Gutscheinen oder Preisaktionen | Nur einmal pro Einkauf einlösbar | Gutschein wird auf max. 500€ Bestellwert angerechnet | Keine Barauszahlung | Digitale Hörbücher nur für Android  | Nicht gültig für preisgebundene Artikel (aufgrund der Buchpreisbindung sind Gutscheine nicht auf Bücher, eBooks, Presse einlösbar), tolino eReader & Zubehör, Abonnements & Flatrates, Geschenkkarten, Versandkosten und Services

  • Produktbild: Statistics for Linguists
  • Produktbild: Statistics for Linguists
- 18%

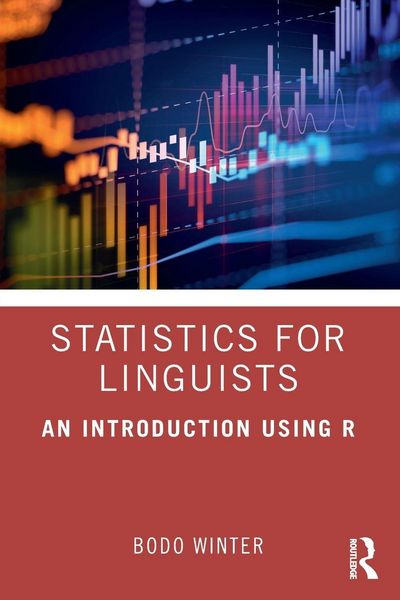
Statistics for Linguists An Introduction Using R

18% sparen

63,99 € UVP 78,20 €

inkl. gesetzl. MwSt., Versandkostenfrei


Beschreibung

Statistics for Linguists: An Introduction Using R is the first statistics textbook on linear models for linguistics. The book covers simple uses of linear models through generalized models to more advanced approaches, maintaining its focus on conceptual issues and avoiding excessive mathematical details....

Beschreibung

Statistics for Linguists: An Introduction Using R is the first statistics textbook on linear models for linguistics. The book covers simple uses of linear models through generalized models to more advanced approaches, maintaining its focus on conceptual issues and avoiding excessive mathematical details. It contains many applied examples using the R statistical programming environment. Written in an accessible tone and style, this text is the ideal main resource for graduate and advanced undergraduate students of Linguistics statistics courses as well as those in other fields, including Psychology, Cognitive Science, and Data Science.

Produktdetails

Einband

Taschenbuch

Erscheinungsdatum

13.11.2019

Abbildungen

65 SW-Zeichn.

Verlag Taylor & Francis

Produktdetails

Einband

Taschenbuch

Erscheinungsdatum

13.11.2019

Abbildungen

65 SW-Zeichn.

Verlag Taylor & Francis
Seitenzahl

328

Maße (L/B/H)

22,9/15,2/1,8 cm

Gewicht

477 g

Sprache

Englisch

ISBN

978-1-138-05609-1

Herstelleradresse

Libri GmbH
Europaallee 1
36244 Bad Hersfeld
DE

Email: gpsr@libri.de

Ein neues Kapitel für Ihre Bücher

Ein neues Kapitel für Ihre Bücher

Schenken Sie Ihren alten Schätzen ein zweites Leben und erhalten Sie dafür eine Thalia Geschenkkarte.

Jetzt verkaufen
Jetzt verkaufen

Noch keine Bewertungen vorhanden

Verfassen Sie die erste Bewertung zu diesem Artikel

Helfen Sie anderen Kundinnen und Kunden durch Ihre Meinung.

Kundinnen und Kunden meinen

Bewertungen (0)

Die Leseprobe wird geladen.
  • Produktbild: Statistics for Linguists
  • Produktbild: Statistics for Linguists
  • Table of contents

    0. Preface: Approach and how to use this book

    0.1. Strategy of the book

    0.2. Why R?

    0.3. Why the tidyverse?

    0.4. R packages required for this book

    0.5. What this book is not

    0.6. How to use this book

    0.7. Information for teachers

    1. Introduction to base R

    1.1. Introduction

    1.2. Baby steps: simple math with R

    1.3. Your first R script

    1.4. Assigning variables

    1.5. Numeric vectors

    1.6. Indexing

    1.7. Logical vectors

    1.8. Character vectors

    1.9. Factor vectors

    1.10. Data frames

    1.11. Loading in files

    1.12. Plotting

    1.13. Installing, loading, and citing packages

    1.14. Seeking help

    1.15. A note on keyboard shortcuts

    1.16. Your R journey: The road ahead

    2. Tidy functions and reproducible R workflows

    2.1. Introduction

    2.2. tibble and readr

    2.3. dplyr

    2.4. ggplot2

    2.5. Piping with magrittr

    2.6. A more extensive example: iconicity and the senses

    2.7. R markdown

    2.8. Folder structure for analysis projects

    2.9. Readme files and more markdown

    2.10. Open and reproducible research

    3. Models and distributions

    3.1. Models

    3.2. Distributions

    3.3. The normal distribution

    3.4. Thinking of the mean as a model

    3.5. Other summary statistics: median and range

    3.6. Boxplots and the interquartile range

    3.7. Summary statistics in R

    3.8. Exploring the emotional valence ratings

    3.9. Chapter conclusions

    4. Introduction to the linear model: Simple linear regression

    4.1. Word frequency effects

    4.2. Intercepts and slopes

    4.3. Fitted values and residuals

    4.4. Assumptions: Normality and constant variance

    4.5. Measuring model fit with

    4.6. A simple linear model in R

    4.7. Linear models with tidyverse functions

    4.8. Model formula notation: Intercept placeholders

    4.9. Chapter conclusions

    5. Correlation, linear, and nonlinear transformations

    5.1. Centering

    5.2. Standardizing

    5.3. Correlation

    5.4. Using logarithms to describe magnitudes

    5.5. Example: Response durations and word frequency

    5.6. Centering and standardization in R

    5.7. Terminological note on the term 'normalizing'

    5.8. Chapter conclusions

    6. Multiple regression

    6.1. Regression with more than one predictor

    6.2. Multiple regression with standardized coefficients

    6.3. Assessing assumptions

    6.4. Collinearity

    6.5. Adjusted

    6.6. Chapter conclusions

    7. Categorical predictors

    7.1. Introduction

    7.2. Modeling the emotional valence of taste and smell words

    7.3. Processing the taste and smell data

    7.4. Treatment coding in R

    7.5. Doing dummy coding 'by hand'

    7.6. Changing the reference level

    7.7. Sum coding in R

    7.8. Categorical predictors with more than two le